Sixty days. A window and door installer went from an agency buying cheap leads that went nowhere to seven signed jobs, by fixing what happened after the inquiry before touching the ad account.
How these numbers are defined. The £28,000 is signed contract value across seven jobs, excluding VAT. It is not profit and it is not cash collected. The 13.3 times figure is that signed contract value divided by advertising spend only, so it is a return on ad spend rather than a full marketing return: it excludes our fee, materials, labor, installation and every other cost of delivering the work.
A London installer of aluminum bifold doors, sliding doors and window systems. Three fitting teams, their own installers rather than subcontractors, a ten year guarantee, and capacity for roughly three houses a week. A good business with a real product.
Their previous agency had been running Meta ads at a headline cost per inquiry of £8.25. On the surface that is an excellent number. £5,246 of spend had produced 636 inquiries.
Of those 636 inquiries, roughly ten became jobs. That is a conversion rate of about 1.6 percent, and a real cost of around £524 for every job actually won.
Cheap leads are not the same thing as cheap customers.
626 of those 636 inquiries went nowhere. Not because the ads were wrong, and not because the audience was wrong. They died in the gap between the form submission and the phone call.
A homeowner fills in a form on a Tuesday evening with three other tabs open. If nothing reaches them for two hours, by the time the installer calls on Thursday morning they have already spoken to somebody else, or forgotten they inquired at all.
Cost per lead is the metric agencies report because it is the one that looks best. It is not the one that pays for the vans. Spend applied to a leaking funnel does not fill it faster, it drains faster.
This was not a media buy. Paid traffic was the final layer, switched on only after the capture and follow up underneath it was built and tested. Here is what happens to a single inquiry, with the real timings from a live one.
From the advert, the website, the chatbot or the tracked phone number. All of them arrive in the same place.
Sent back within seconds, while they are still on the page.
Push, text and email at once, because you are on a ladder or in a van.
If you have, everything below stops and the customer hears nothing more from the system.
Where this audience actually replies, and it carries photographs both ways.
Sent to your phone.
Then nothing further is sent. Nobody gets chased into annoyance.
The last prompt from us.
Every inquiry tracked to a result. Nothing sitting forgotten in an inbox.
The gate in the middle is the part that matters. The system is not trying to replace the phone call, it is trying to buy the owner time to make it. The moment he calls, every remaining message is canceled and the customer never knows a sequence existed.
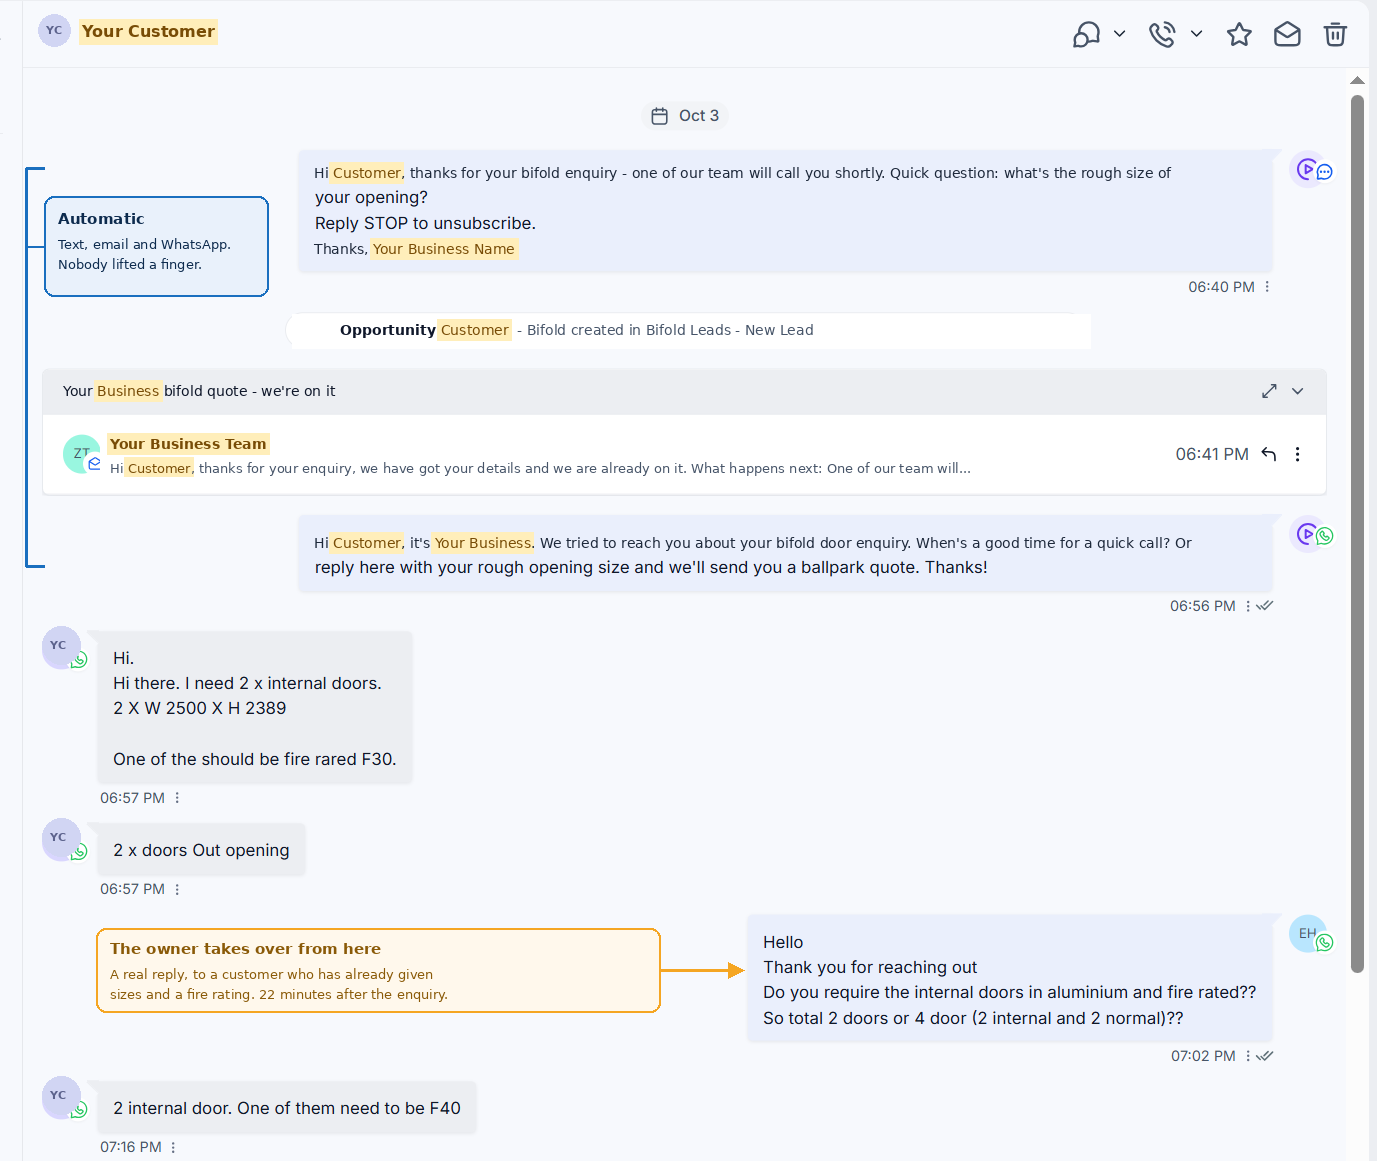
One inquiry, start to finish, from the evening it arrived.
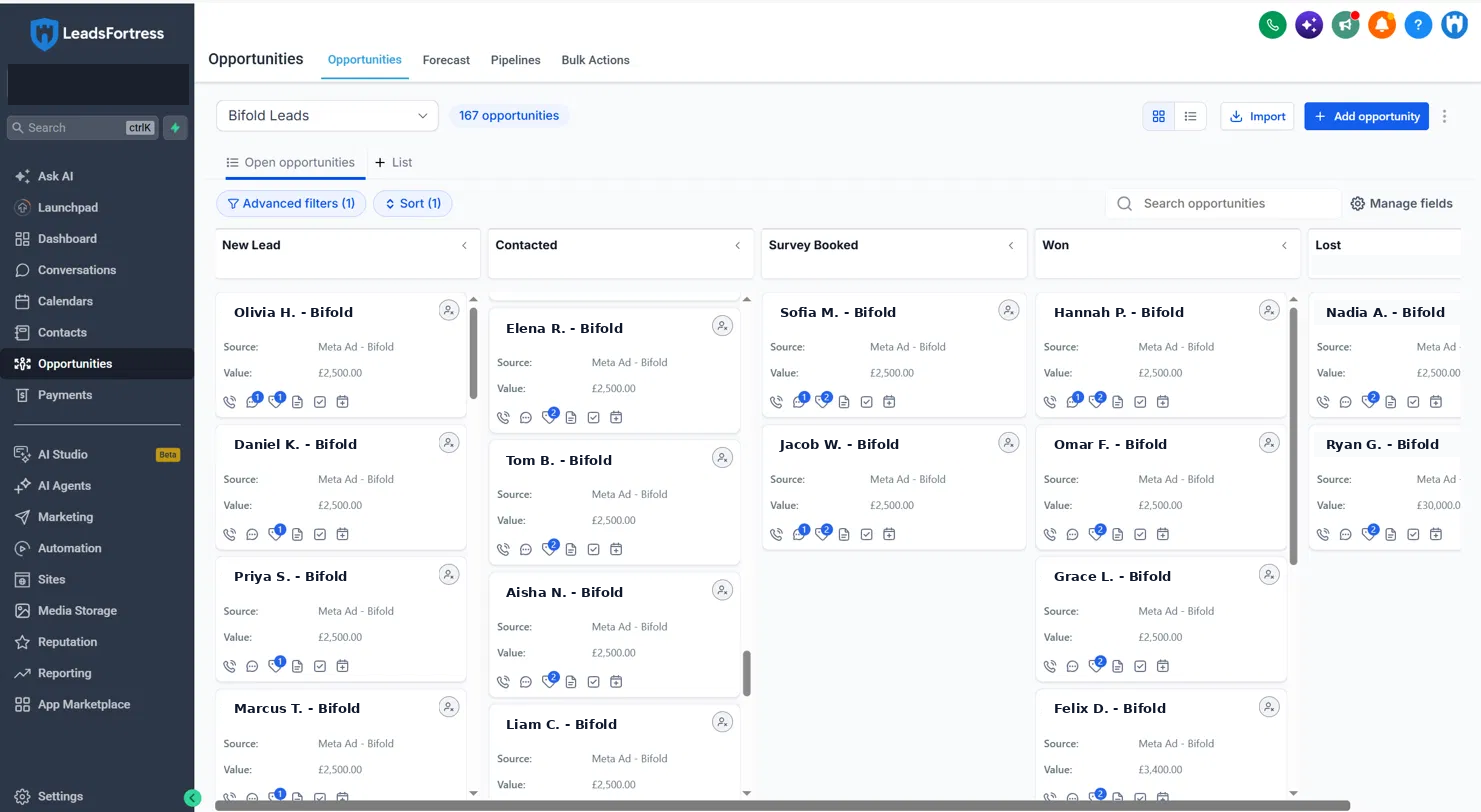
Open full sizeEach inquiry becomes a card and moves through a visible pipeline: new lead, contacted, survey booked, won. Nothing depends on anyone remembering to follow up, because the stage a job sits in is a fact on a board rather than a memory.
Open full size123,656 impressions across sixty days. The two months look completely different, and the sequence is the point.
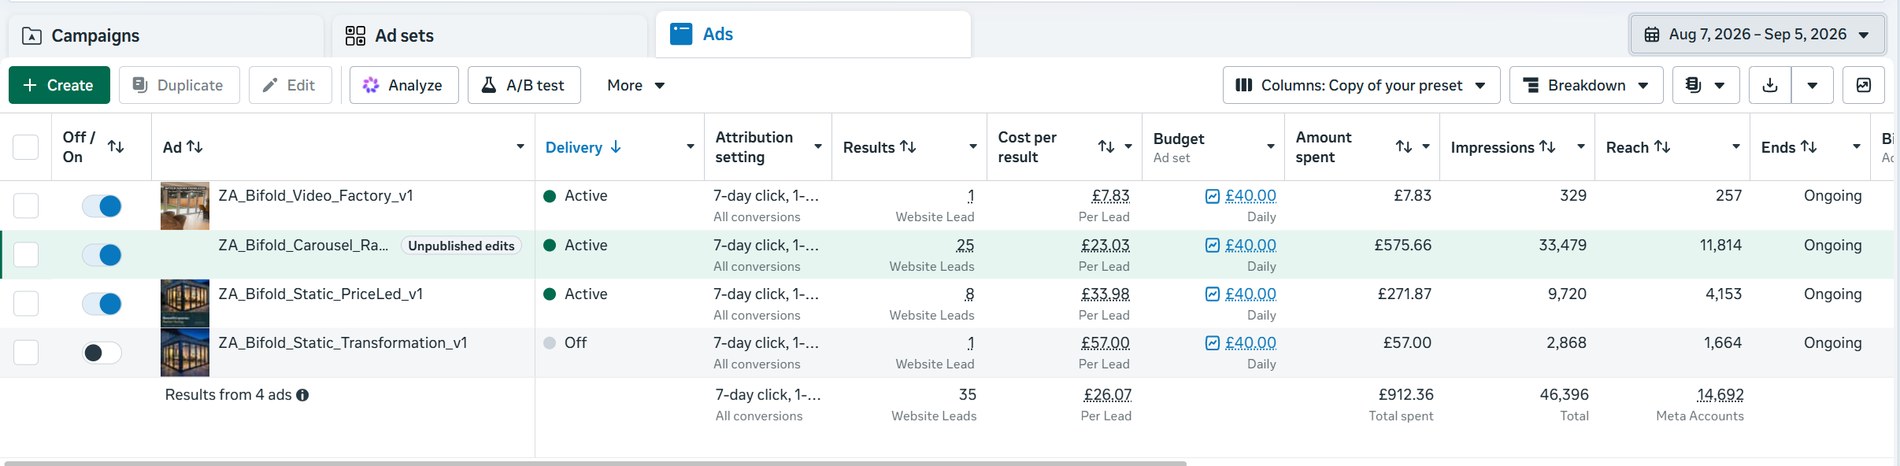
Budget £30 a day, four creatives running against each other.
| Creative | Spend | Inquiries | Cost each |
|---|---|---|---|
| Carousel, product range | £575.66 | 25 | £23.03 |
| Static, price led | £271.87 | 8 | £33.98 |
| Static, transformation | £57.00 | 1 | £57.00 |
| Video, workshop | £7.83 | 1 | £7.83 |
| Total | £912.36 | 35 | £26.07 |
Open full sizeThe workshop video shows £7.83 a lead in month one, which would make it the best performer in the account. It was not, and we did not act on it. That number rested on a single conversion from 329 impressions. If one more click had failed to convert it would have read £15.66 and sat mid table. The carousel, with 25 conversions behind it, was the only creative with enough volume to be judged. So the video was left alone and scheduled for its own ring fenced test budget instead.
One thing to note in the screenshot above. The Budget column reads £40.00 daily even though month one ran at £30. Meta reports the ad set’s current budget rather than its setting during the dates selected, and the budget was raised at the start of month two. The spend column is the accurate record: £912.36 across 30 days is £30.41 a day. Month two’s £1,199.49 is £39.98 a day.
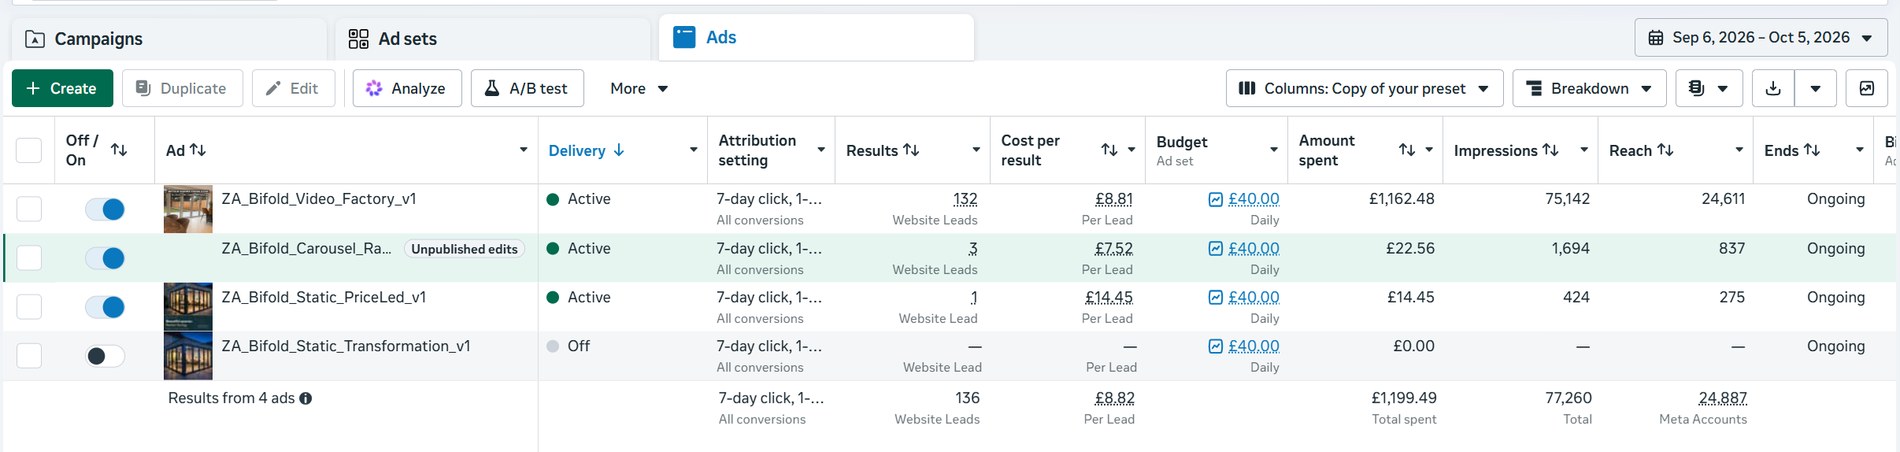
Budget raised to £40 a day, on the strength of a proven cost per job rather than a promising cost per lead.
| Creative | Spend | Inquiries | Cost each |
|---|---|---|---|
| Video, workshop | £1,162.48 | 132 | £8.81 |
| Carousel, product range | £22.56 | 3 | £7.52 |
| Static, price led | £14.45 | 1 | £14.45 |
| Total | £1,199.49 | 136 | £8.82 |
Open full sizeGiven its own budget, the video produced 132 inquiries in a month. Patience, not cleverness, is what made that possible. Had we moved budget on the strength of one conversion in month one, we would have been right by accident, and the same reasoning would have wrecked the account the next time a single lead made a bad creative look brilliant.
This installer charges a £500 minimum deposit to attend a site survey, credited against the job. Nobody gets visited without paying first, which is a filter no reporting dashboard can fake.
| Month one | Month two | Combined | |
|---|---|---|---|
| Ad spend | £912.36 | £1,199.49 | £2,111.85 |
| Inquiries | 35 | 136 | 171 |
| Cost per inquiry | £26.07 | £8.82 | £12.35 |
| Paid site surveys booked | 5 | 5 | 10 |
| Cost per booked survey | £182.47 | £239.90 | £211.19 |
| Jobs signed | 2 | 5 | 7 |
| Signed work | £10,000 | £18,000 | £28,000 |
| Cost per job won | £456 | £240 | £302 |
| Return on ad spend | 10.9× | 15.0× | 13.3× |
The honest wrinkle. Inquiry to job was 5.7 percent in month one and 3.7 percent in month two. The video's inquiries are individually softer than the carousel's, which is what usually happens when volume climbs that steeply. They are cheap enough that the economics improved anyway, and cost per job won roughly halved. But the conversion rate moved the wrong way, and a case study that hid that would not be worth reading.
Month one: 35 inquiries produced 5 booked surveys. One of the five converted, into two jobs at £3,500 and £6,500. A one in five survey to close rate is exactly the rate this business quotes from its own historic sales data, which is the whole point. The system did not need to improve their sales process. It needed to put more people in front of it.
Month two: 136 inquiries produced 5 booked surveys, and all five converted. That is a far better close rate than this business normally sees and the sample is small, so we would not promise it repeats. What it does show is that a paid survey is a serious filter: nobody pays a £500 deposit to have somebody visit out of curiosity.
Both accounts bought attention from the same audience in the same postcodes. One number got worse and the one that matters got better.
| Metric | Previous agency | First 60 days with us |
|---|---|---|
| Cost per inquiry | £8.25 | £12.35 |
| Inquiry to job | Approx 1.6% | 4.1% |
| Cost per job won | Approx £524 | £302 |
| Jobs per month | Approx 1.7 | 3.5 |
Both columns count signed jobs only. The difference is not the ads. The difference is that in the second case something answered the inquiry within seconds, chased it across three channels, and put it in front of a surveyor.
Optimize for cost per signed customer, not cost per form submission.
This is a before and after operating comparison, not a controlled experiment. Campaign setup, creative, landing destination, follow up and conversion tracking all changed between the two periods, and the two ran in different months. The claim being made is not that our ads are better than theirs. It is that changing the system around the lead changed the economics.
£8.25 a lead sounds better than £12.35 a lead right up until you count jobs. Ask any agency quoting you a cost per lead what their cost per job won is. If they cannot answer, they are not measuring the thing you get paid on.
The ads in both accounts were buying the same homeowners in the same neighborhoods. What changed was that a text, an email and a WhatsApp message reached each one before they moved on. That alone took inquiry to job from 1.6 percent to 4.1 percent.
Turn paid media on above a funnel that leaks and you get what the previous agency got: 636 inquiries and 626 of them wasted. The system is the permanent asset. The ad budget is just a dial on top of it.
The cheapest looking ad in month one had a single lead behind it. We left it alone, and a month later it produced 132. Small numbers produce dramatic percentages. Wait for volume, then decide.
Advertising figures are from Meta Ads Manager for 7 August to 5 October 2026. Survey and job figures were confirmed with the client at the monthly reviews. Revenue excludes VAT and counts signed work only; work still in progress is excluded throughout. All inquiries, surveys and jobs behind the revenue and cost per job figures came from this campaign, and contacts arriving through other routes are counted separately and excluded from those figures. This is a UK business and figures are in pounds sterling. Window and door installation is a home service trade, but the market is not identical to a US one, so read the mechanism rather than the exact numbers.
Most contractors have no idea, because nothing in their business measures it. Your free Growth Score checks how fast your site answers an inquiry, what happens to it afterwards, and where your leads are leaking today.
Get My Free Growth Score →The paid media in this case study sits under the Growth Accelerator. The capture and follow up underneath it is the LeadsFortress Growth System.